
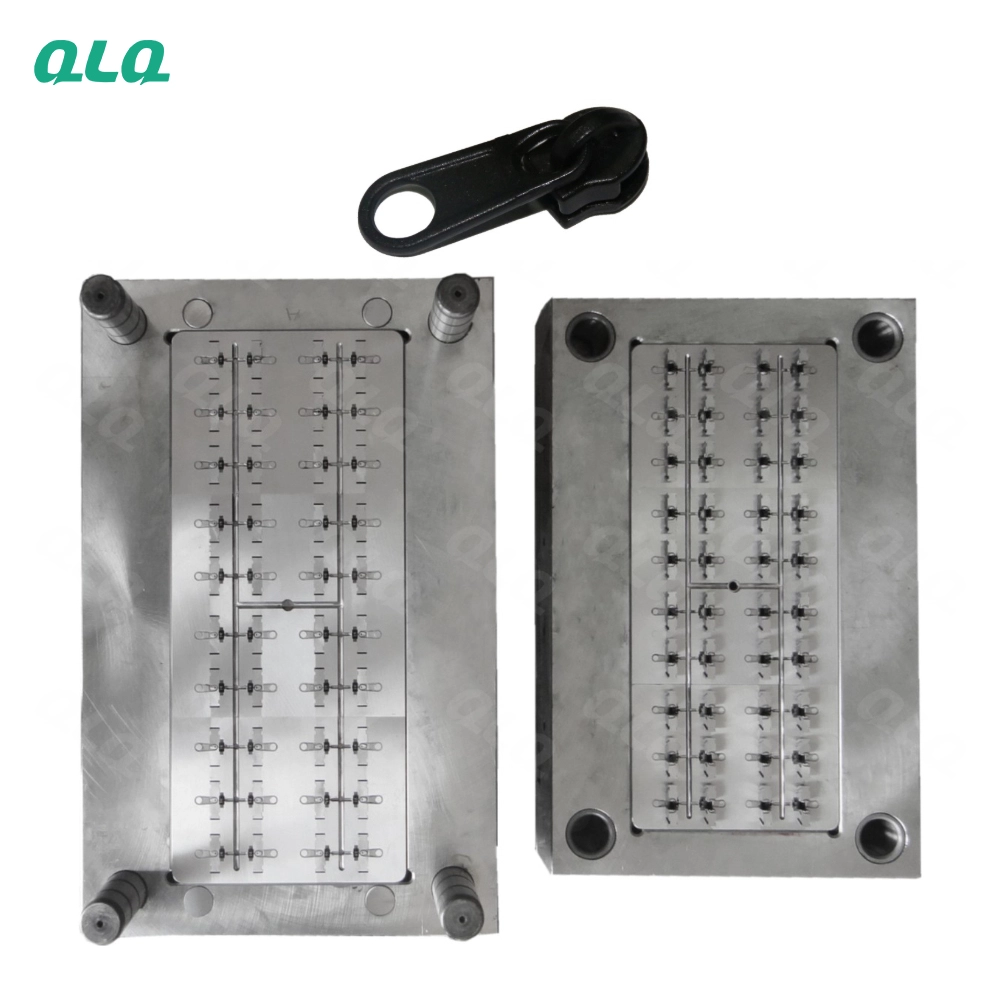
POM slider output is not set by the injection machine nameplate; it is set by cavities per shot, cycle time, running hours and how many machines one person can look after. Two factories with identical machines can differ by 40% in daily output simply because one planned cavities and labor and the other did not.
This guide gives the planning method behind the reference figure of 15,000-25,000 sliders per machine per day at 48 cavities: how to estimate shots per hour, machines required, operator loading of 2-4 machines per person, and the cost elements that decide whether a POM slider order is profitable.
Common Mistakes and How to Avoid Them
The pitfalls that show up most often in real projects, with the cause and the practical fix.
| Mistake | Why It Happens | Practical Fix |
|---|---|---|
| 1. Planning output from machine size only | Small machines with high cavities can outproduce large machines with low cavities | Plan from cavities x shots per hour x running hours |
| 2. Ignoring cooling time | Output estimates collapse when real cooling is 8 seconds | Measure actual cycle, not the quoted best cycle |
| 3. Counting 24 hours as production | Setup, color change, breaks and rejects consume time | Use 80-85% efficiency for planning |
| 4. One operator for too many machines | Quality drops when nobody checks parts | Balance machine count with alarms and automatic sorting |
| 5. No buffer between molding and assembly | One stop stops everything downstream | Plan in-process buffer boxes with quantity labels |
| 6. Undersized degating capacity | Molded parts pile up waiting for runner removal | Match degating and sorting labor to machine output |
| 7. Costing without rejects and regrind | Price looks good until scrap is counted | Include reject rate and regrind in cost per piece |
| 8. No color-change plan | Changing colors wastes 30-60 minutes per machine | Group orders by color to reduce changeovers |
| 9. Running everything in one shift | Machine capital idle for 16 hours a day | Two shifts pay back faster on high-cavity tools |
| 10. No output log | You cannot improve what you do not measure | Record shots, rejects and downtime per shift |
Best Practices That Hold Up in Production
The operating disciplines that separate a reliable line from a reactive one.
- Calculate capacity as cavities x shots/hour x running hours x efficiency
- Measure the real cycle including cooling, ejection and degating
- Plan at 80-85% efficiency, not at nominal 24 hours
- Assign one operator to 2-4 machines with process alarms
- Keep labeled buffers between molding, finishing and assembly
- Group orders by color to cut changeover time
- Log output, rejects and downtime per machine per shift
- Review monthly whether the cavity count still fits the order mix
Implementation Roadmap
A practical sequence that can be adapted to your own project.
Working Data & Formula Notes
Capacity planning numbers for POM sliders
Reference values from QLQ slider production notes; replace with your measured cycle and efficiency for quotations.
| Component / Parameter | Working Value / Role | What Changes Mean (annotation) |
|---|---|---|
| Output reference | 15,000-25,000 pcs/day per machine at 48 cavities | This assumes a stable cycle and two shifts; low values usually mean long cooling or high rejects |
| Cycle components | Injection, packing, cooling 3-8s, ejection | Cooling is the largest controllable part; do not cut it to chase output |
| Running hours | 20-24 hours over two/three shifts | Single shift leaves expensive mould and machine capital idle |
| Planning efficiency | 80-85% of nominal | Setup, color change, breaks and rejects are real; 100% is not a plan |
| Operator loading | 1 person for 2-4 machines | More machines per person needs automatic sorting and alarms |
| Regrind handling | Define virgin/regrind ratio per product | Uncontrolled regrind lowers strength and changes color |
| Reject allowance | Include in the quote | Rejects are part of cost per piece, not an afterthought |
Reference Data
Specifications and references cited in this guide. Confirm final parameters with your line supplier.
Daily output estimate by cavity count
| 16 cavities | 5,000-9,000 pcs/day approx. | Sampling and small orders |
| 24 cavities | 8,000-13,000 pcs/day approx. | Medium flexible orders |
| 40 cavities | 13,000-20,000 pcs/day approx. | Medium-high volume |
| 48 cavities | 15,000-25,000 pcs/day approx. | Core production sizes |
| 72 cavities | 22,000-38,000 pcs/day approx. | Very large dedicated orders |
Cost elements for POM slider quotes
| Resin and masterbatch | Material cost by part weight and color ratio | Largest material element; track per piece weight |
| Regrind credit | Runners and sprues reused at defined ratio | Reduces material cost when controlled |
| Power | Machine, dryer and auxiliary load | Dryers run continuously; do not switch off for short breaks |
| Labor | Injection operator + degating + assembly | Labor per piece falls as cavities rise |
| Tool amortization | Mould cost spread over expected shots | Higher cavities need higher utilization to pay back |
| Rejects | Defect rate allowance | Controlled process keeps this under 2-3% |
Shift and buffer planning
| Shift pattern | Two shifts = 16-20 hours; three shifts = 24 hours | More shifts pay back high-cavity tools faster |
| Buffer size | Half a shift of molded parts before assembly | Protects assembly from short molding stops |
| Color grouping | Run all orders of one color together | Cuts changeover to 1-3 per week |
| Downtime log | Setup, color change, break, reject causes | Data drives the next improvement |
Implementation Cases
Case 1 - output doubled by matching cavities to demand
Situation. A slider factory in Bangladesh was quoting large POM orders with a 16-cavity tool and losing them on price and delivery.
Approach. After confirming a steady order for one core size, the factory invested in a 48-cavity tool and moved to two shifts with one operator per three machines.
Outcome. Daily output rose from about 6,000 to over 18,000 sliders per machine, unit cost fell enough to win the export order, and the 48-cavity tool paid back within the planned period.
Case 2 - cost model exposed hidden rejects
Situation. A producer in Vietnam quoted POM sliders on nominal output and discovered at month end that rejects and color changes had erased the margin.
Approach. The team started logging rejects by cause, grouped orders by color, and set a regrind ratio. Quotes were recalculated with 85% efficiency and a 2.5% reject allowance.
Outcome. Actual margin matched the quote, and the color-change log showed two changeovers per week were unnecessary and could be eliminated.
Frequently Asked Questions
How many POM sliders can one injection machine make per day?
With a 48-cavity mould the reference is 15,000-25,000 sliders per machine per day over two shifts. The real number depends on cycle time, efficiency and rejects.
How do I calculate the output of a slider mould?
Use cavities x shots per hour x running hours x efficiency. For example 48 cavities x 500 shots/hour x 20 hours x 0.85 gives about 408,000 parts per day before considering multiple cavities per part.
How many machines can one operator manage?
One experienced operator can monitor 2-4 injection machines when the process is stable and alarms are set. Automatic sorting is recommended for very short cycles.
Why is my actual output much lower than the machine brochure?
Brochures quote the best cycle with zero stops. Real lines lose time to setup, color change, breaks and rejects. Plan at 80-85% efficiency.
Should I run one or two shifts for POM sliders?
High-cavity tools need utilization to pay back. Two shifts typically double output with the same tool and improve cost per piece; start with two shifts when demand is steady.
How should I handle runners and sprues?
Grind and reuse them at a controlled ratio with virgin material. Uncontrolled regrind lowers strength and changes color. Label all regrind containers.
How much does a POM slider cost to make?
Cost per piece depends on material weight, regrind credit, power, labor, tool amortization and rejects. Build the cost model with measured cycle and real reject rate before quoting.
Does color change cost much time?
Yes, a color change can cost 30-60 minutes per machine. Group orders by color and schedule all same-color orders together to cut changeover time.
What Would You Like to Solve?
Send us your slider size, monthly demand and current cycle time, and we can help you build the capacity and cost model - cavity count, machine count, labor and buffer planning - before you quote the order.
Published by QLQ - a complete high-quality zipper manufacturing equipment, moulds and materials solution supplier, and the only supplier in China covering the full process chain from raw material through electroplating and painting as one integrated system. Values cited are project references; confirm with your line supplier before specification.